 SUNDAYGAP
COT report: where speculators are positioned
The Commitments of Traders (COT) report is the CFTC's weekly count of how many contracts big traders hold long and short in each futures market. Below is this week's data for ES, NQ, Dow, Russell, crude oil, gold, 10-year notes, the euro and bitcoin, in plain English. Updated every Friday.
The biggest shift this week was in E-mini Nasdaq-100, where large speculators cut 13,742 contracts from their net position. They're most heavily net long Gold (47% of open interest) and most net short 10-Year T-Note (16% of open interest).
Positions as of Tuesday, November 10, released Friday, November 13. Next report: Friday, November 20 at 2:30 PM CT.
| Market | Net position | Week | 4 weeks | % of OI |
|---|---|---|---|---|
| E-mini S&P 500ES | Short 138,634 | −9,220 | +2,361 | -6.9% |
| E-mini Nasdaq-100NQ | Long 29,131 | −13,742 | −19,392 | 10.1% |
| E-mini DowYM | Long 8,421 | −1,933 | +285 | 10.1% |
| E-mini Russell 2000RTY | Short 5,755 | +17,899 | +55,248 | -1.3% |
| Crude Oil (WTI)CL | Long 73,982 | −6,307 | −26,361 | 3.9% |
| GoldGC | Long 190,107 | +10,559 | −17,772 | 47.0% |
| 10-Year T-NoteZN | Short 983,916 | −21,557 | +4,186 | -16.1% |
| Euro FX6E | Short 136,396 | +21,395 | +1,177 | -16.0% |
| CME BitcoinBTC | Long 2,375 | +145 | −159 | 12.3% |
Historical COT positioning
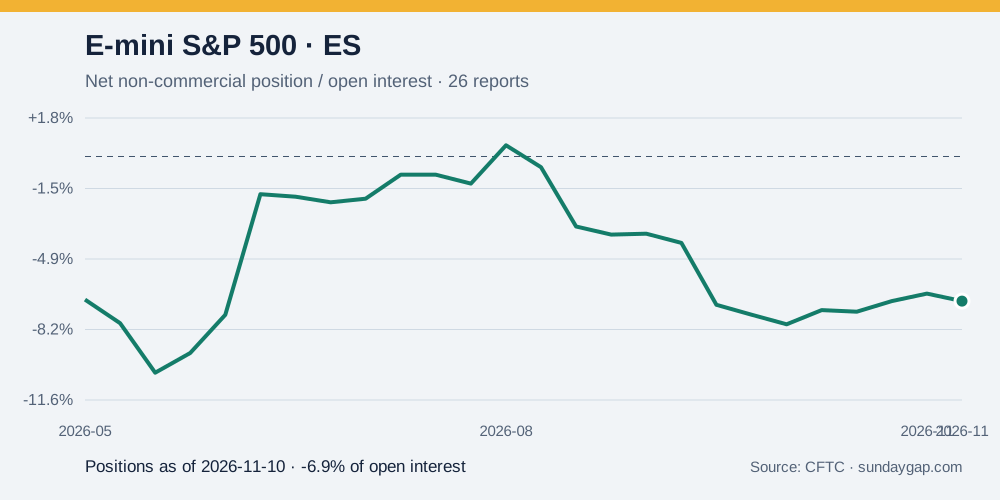
Choose a futures market and compare speculator net positions as a percentage of total open interest. These are Tuesday positions published on Friday, not live prices or signals.
| Report date | Net contracts | Net / open interest |
|---|---|---|
| 2026-11-10 | -138,634 | -6.87% |
| 2026-11-03 | -129,414 | -6.51% |
| 2026-10-27 | -134,368 | -6.87% |
| 2026-10-20 | -142,671 | -7.37% |
| 2026-10-13 | -140,995 | -7.30% |
| 2026-10-06 | -154,070 | -7.97% |
| 2026-09-29 | -142,499 | -7.52% |
| 2026-09-22 | -133,228 | -7.05% |
| 2026-09-15 | -100,461 | -4.11% |
| 2026-09-08 | -76,036 | -3.67% |
| 2026-09-01 | -75,941 | -3.71% |
| 2026-08-25 | -67,994 | -3.32% |
| 2026-08-18 | -10,560 | -0.51% |
| 2026-08-11 | 11,280 | 0.53% |
| 2026-08-04 | -27,258 | -1.29% |
| 2026-07-28 | -17,196 | -0.87% |
| 2026-07-21 | -16,784 | -0.87% |
| 2026-07-14 | -38,938 | -2.01% |
| 2026-07-07 | -42,891 | -2.18% |
| 2026-06-30 | -37,592 | -1.91% |
| 2026-06-23 | -35,448 | -1.79% |
| 2026-06-16 | -193,978 | -7.52% |
| 2026-06-09 | -205,644 | -9.33% |
| 2026-06-02 | -220,768 | -10.27% |
| 2026-05-26 | -165,831 | -7.92% |
| 2026-05-19 | -140,605 | -6.80% |
A percentile describes where today's positioning falls within the selected available reports, not the probability of a price move. Short histories are labeled with their actual observation count. Fewer than 12 observations do not receive a percentile.
How to read this
- Net speculator position is large speculators' (the CFTC's "non-commercial" traders, mostly funds) long contracts minus their short contracts.
- This week and 4 weeks show how that net position changed. Rising numbers mean speculators are getting more bullish or less bearish.
- % of open interest puts positions in context across markets of different sizes. Very large readings can mean a crowded trade.
Worked example: E-mini S&P 500 this week
Large speculators are net short 138,634 contracts in E-mini S&P 500: their longs minus their shorts. That position is down 9,220 contracts on the week and up 2,361 over four weeks. Against all open contracts it is 6.9% of open interest, a net short bias.
What to take from it: a rising net number means funds are getting more bullish or less bearish, and a falling one means the opposite. It describes positioning as of Tuesday, not a forecast.
What COT can and can't tell you
COT shows how big traders are positioned, not where price goes next. The data is three days old when it's published, and positions can stay extreme for months. Many traders use it as background: a sign of how crowded a trade is, or a reason to be careful when price moves against a big, one-sided position.
Source: CFTC Commitments of Traders, legacy futures-only report. General information, not trading advice. See also COT report in the glossary.
Get the week ahead every Sunday
Sunday Gap is a free Sunday email for futures traders: last week's closes, this week's calendar in CT, and what matters before the 5:00 PM CT open.
Free, one email a week. Includes a one-page futures cheat sheet when you confirm.